Every trend tells a story. During an uptrend, buyers continuously push price to new highs. During a downtrend, sellers continue making new lows. A Break of Structure (BOS) is the market confirming that this story is still unfolding. Rather than guessing where price might go next, traders wait for the market to prove that buyers or sellers remain in control.
Learning Objectives
- Understand what a Break of Structure is.
- Recognise bullish and bearish BOS.
- Learn why BOS confirms trend continuation.
- Know how BOS fits into a trading plan.
Definition
A Break of Structure (BOS) occurs when price breaks beyond an important swing point in the direction of the current trend.
If price is already making higher highs and higher lows, breaking the previous swing high confirms that buyers remain in control.
Likewise, during a downtrend, breaking below a previous swing low confirms that sellers continue to dominate.
Concept Diagram
Before looking at a real chart, let's understand the concept in its simplest form.
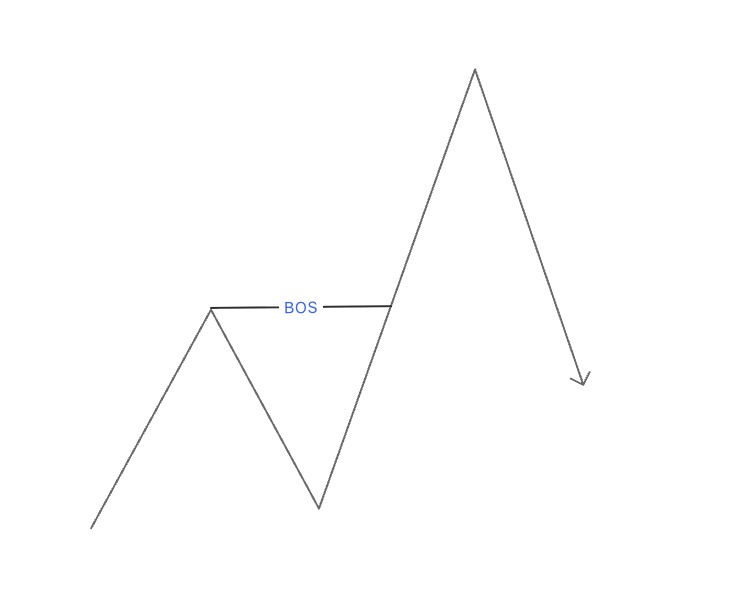
A Break of Structure occurs when price closes beyond a previous swing point in the direction of the trend.
Real Market Example
The image below shows a bullish Break of Structure taken from a real XAUUSD chart. Notice how price first creates higher lows before breaking above the previous swing high. This break confirms bullish continuation.
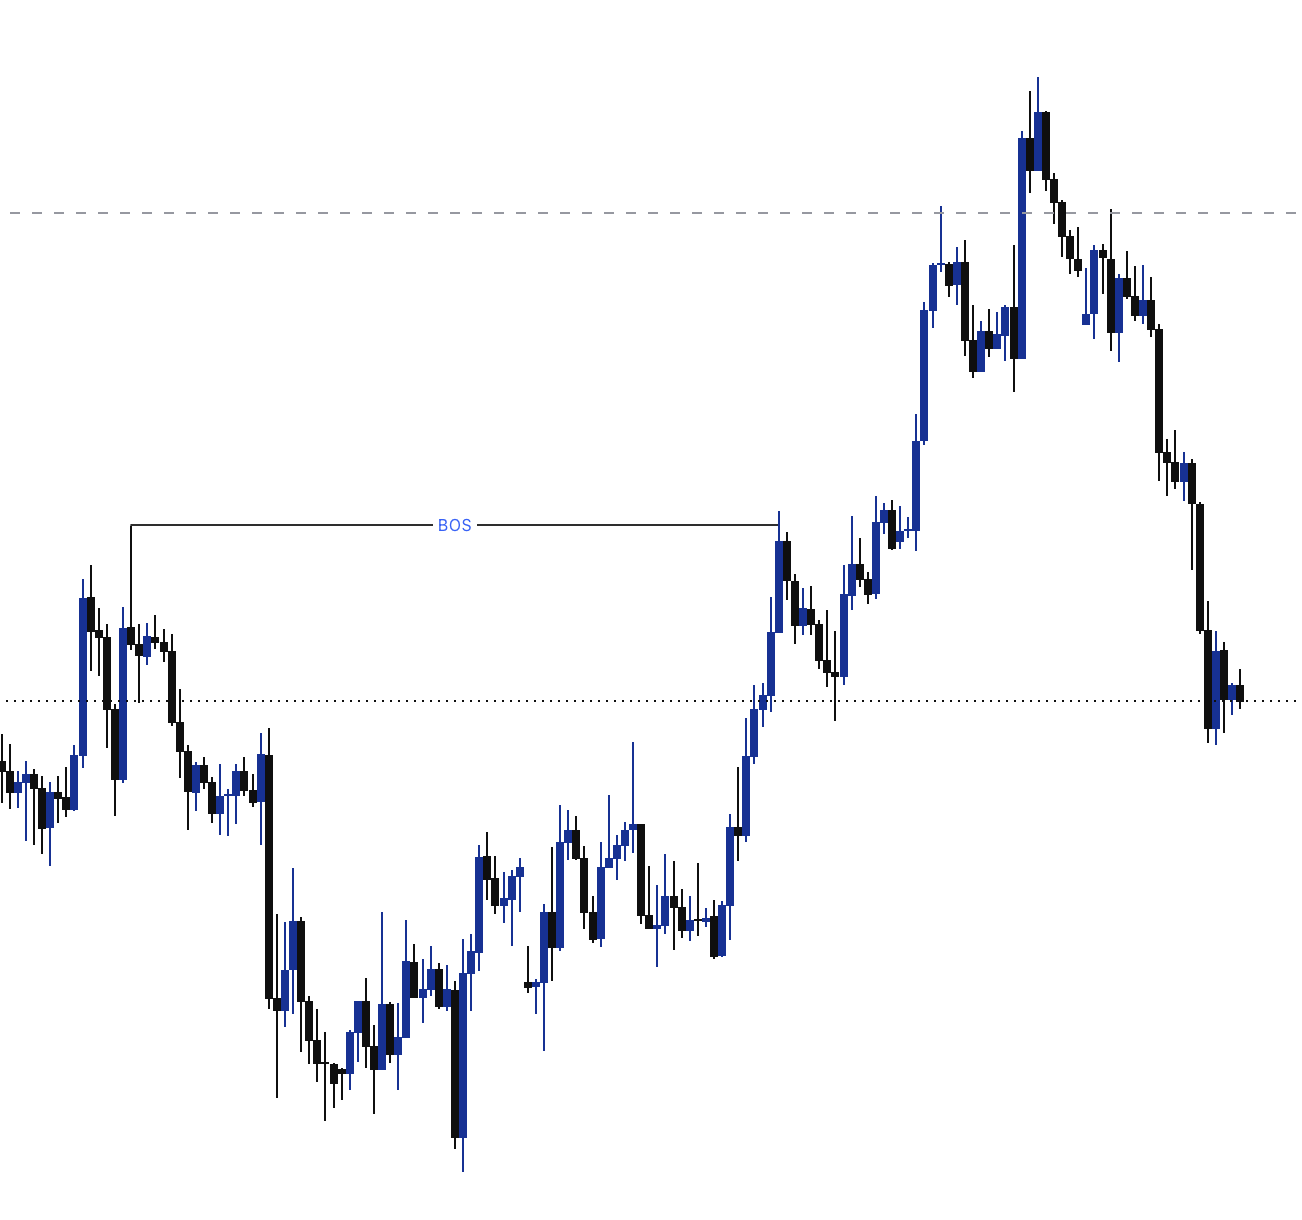
Figure 1. A real bullish Break of Structure identified on XAUUSD.
Why BOS Matters
Many traders enter positions based on emotion or prediction. A Break of Structure removes much of that uncertainty by allowing price itself to confirm the direction first.
Professional traders often wait for a BOS before looking for entries using concepts such as Order Blocks, Fair Value Gaps, or Liquidity Sweeps.
Bullish vs Bearish BOS
📈 Bullish BOS
- Higher highs
- Higher lows
- Break above previous high
- Trend likely continues upward
📉 Bearish BOS
- Lower highs
- Lower lows
- Break below previous low
- Trend likely continues downward
Checklist for a Valid BOS
Common Mistakes
- Treating every breakout as a BOS.
- Ignoring higher timeframe structure.
- Entering before confirmation.
- Confusing BOS with CHoCH.
Key Takeaways
- BOS confirms continuation—not reversal.
- Always identify the overall trend first.
- Wait for a candle close beyond structure.
- Combine BOS with Liquidity, Order Blocks and Fair Value Gaps.
Practise Break of Structure
The fastest way to understand BOS is by marking it on live charts. Open a demo account, identify swing highs and lows, and practise waiting for confirmed Breaks of Structure before analysing entries.
Open a Demo Trading Account →